This article outlines the fundamental usage of Wireshark, a tool employed for capturing network communication.
If you're seeking a more detailed description, you can access it in the official documentation available at Wireshare.
This is particularly valuable when you wish to observe network-level communication (the actual packets) between devices. This detailed perspective aids in troubleshooting tasks like sending jobs to printers or communication involving YSoft SafeQ. The notable benefit lies in the ability to save communication for future analysis or attaching it, along with log files, when reaching out to Customer Support Services.
Resolution:
How to use Wireshark for capturing network communication:
- Download the latest Wireshark version and install it on the YSoft SafeQ server. Once installed, run it.
-
Notes: Wireshark is able to capture only the network communication that is visible to the server where it is installed. Therefore is necessary to find the appropriate server for the installation. Imagine the following scenario:
First computer has web browser that is used by administrator for management of YSoft SafeQ via the management interface.
Second computer is a server in Brazil where YSoft SafeQ management server and site server is deployed.
Third computer is a server in Austria where YSoft SafeQ site server is deployed.-
When you need to capture the network communication related to failing installation of the MFD connected to the server in Brazil, Wireshark has to be deployed on the Second computer.
- When you need to capture the network communication related to failing installation of the MFD connected to server in Austria, Wireshark has to be deployed on the Third computer.
-
-
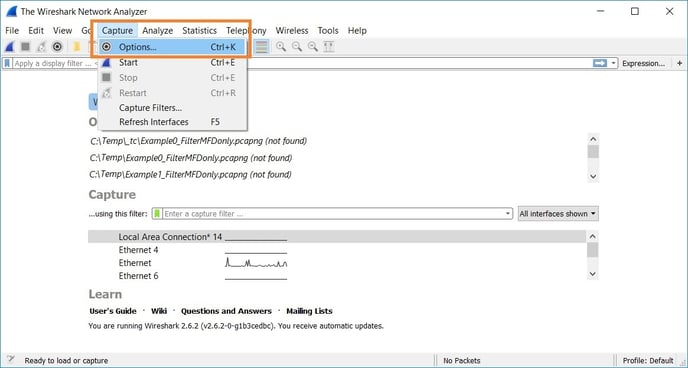
- Go to Capture -> Options

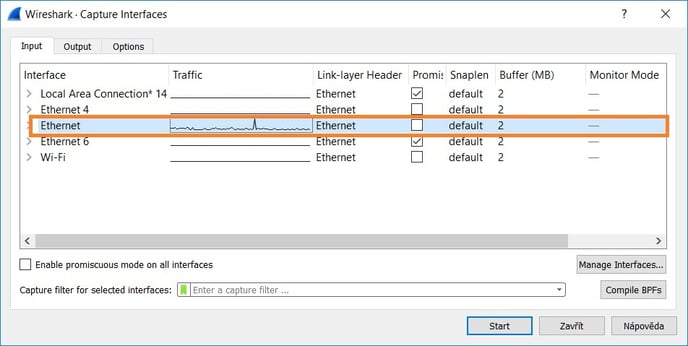
- Configure the capture options and start the capture:
- Select network interface which sends data (hold CTRL while clicking the adapters if you want to select more of them at the same time). With the latest versions of Wireshark the Npcap driver is installed and the "Npcap Loopback Adapter" is listed among adapters, selecting this adapter would allow you to capture the traffic on the localhost (e.g. traffic between YSoft SafeQ components).

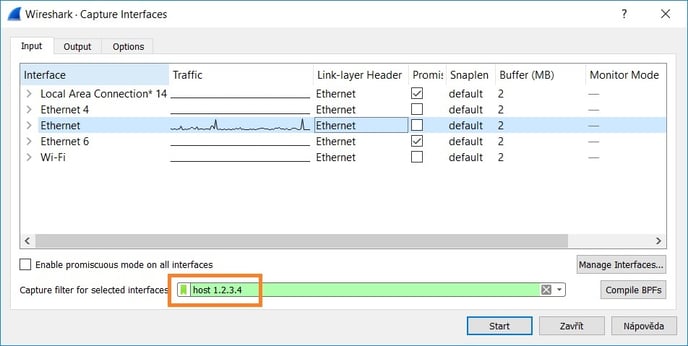
- Set capture filter to host <printer_or_terminal_IP_address>, that way only the network traffic with the specified address will be recorded. Do not forget to replace the 1.2.3.4 with the real IP address of monitored device. If you would like to monitor more than one IP address, you can use an OR condition like this: host 1.2.3.4 || host 5.6.7.8 . More examples of capture filters can be found at Wireshark's Wiki (Capture Filters) .

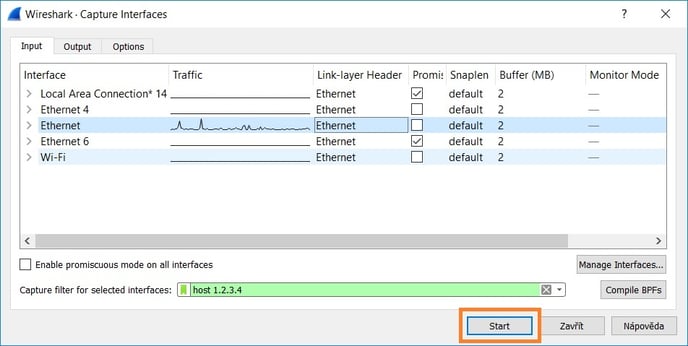
- Start the capturing phase.

- Select network interface which sends data (hold CTRL while clicking the adapters if you want to select more of them at the same time). With the latest versions of Wireshark the Npcap driver is installed and the "Npcap Loopback Adapter" is listed among adapters, selecting this adapter would allow you to capture the traffic on the localhost (e.g. traffic between YSoft SafeQ components).
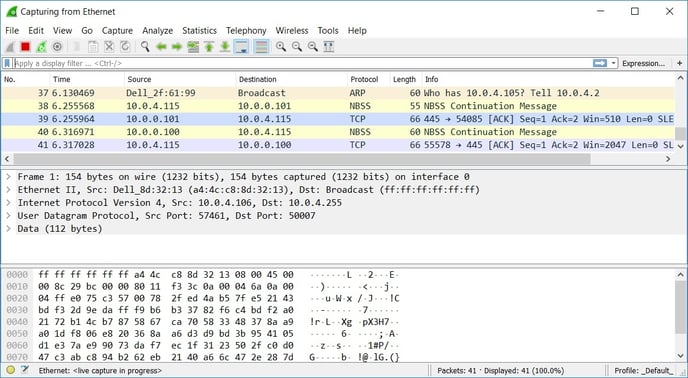
- As the device communicates with the server, new lines will appear.

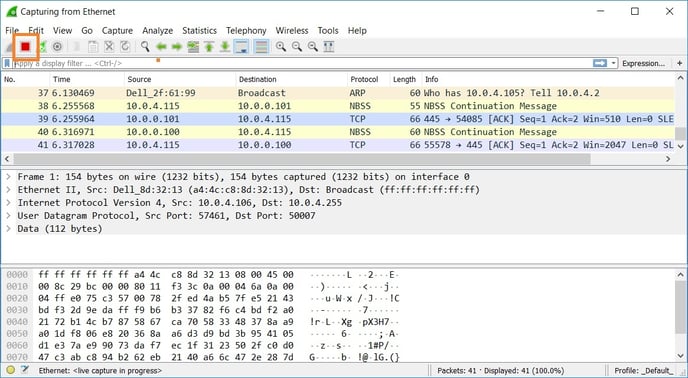
- Once all the tests are done, stop the data capturing.

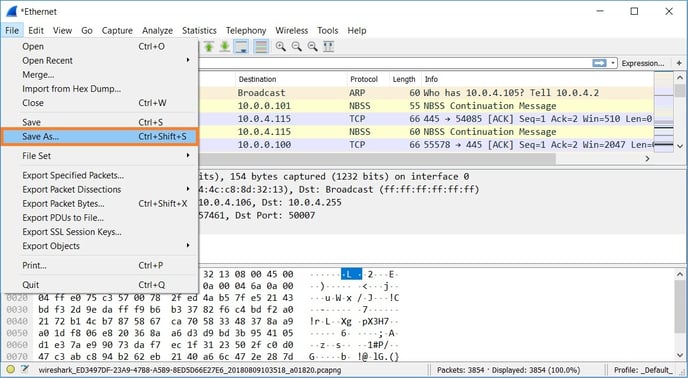
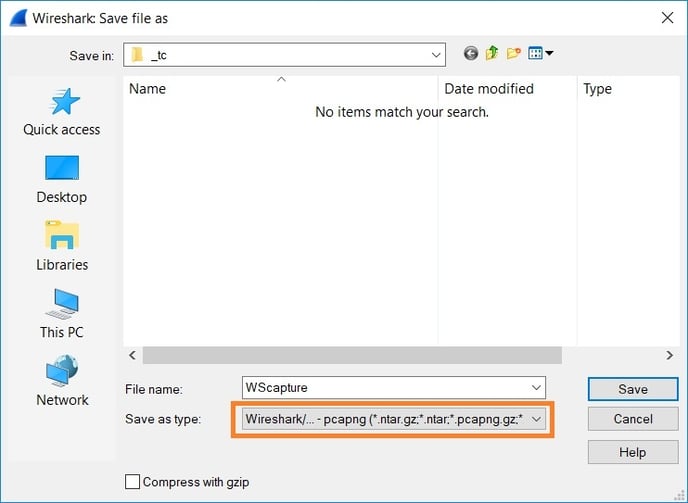
- Save the captured packets to pcap format.


Dumpcap
If you plan capturing traffic for a longer period of time (e.g. 4 hours), use Dumpcap instead of Wireshark or Wincap. Wireshark and Wincap crashes very often no matter if file rolling is used. The reason is they keep track of all the packets and reassemble them. Dumpcap instead only captures the packets while we can reassemble them later.
The Dumpcap.exe tool is located in the Wireshark installation folder (default: C:\Program Files\Wireshark).
Usage:
We recommend to download DumpcapAutomation.zip and follow readme.txt, this sets up a scheduled task under the SYSTEM account for the capture.
Capture ran by dumpcap.exe in the command prompt stops when the prompt is closed, for example on a logout from MS Windows.
Command prompt example:
dumpcap.exe -i1 -p -n -f "(host 10.0.10.20 || host 10.0.10.21) && (portrange 5012-5030 || port 80 || port 443 || port 50003" -w C:\SafeQ4\Dumpcap\Capture_Interface1.pcapng -b duration:3600 -b files:48
Explanation of the parameters:
-i1 - capture traffic on interface 1. To list all the interfaces that can be monitored use command: dumpcap -D.
-p - do not capture in promiscuous mode
-n - use pcapng format instead of default pcap.
-f - capture filter, provided example captures incoming/outgoing traffic for two mentioned IP addresses on the defined list of ports or port range and no matter what protocol is used (TCP/UDP) (pcap filter syntax )
-w - output file.
-b - capture ringbuffer options (duration, filesize, files). Make sure there is enough free space in the destination folder to save the capture files.
-s100 - the parameter is not listed in the example but it can be potentially used as well, it would trim size of captured packets to 100 bytes
-- benefit: it can be used for basic review of connectivity issues where seeing packet headers is sufficient (MAC address, IP address, Port); it makes captures much smaller; since the packets are trimmed, even the unencrypted traffic the traffic cannot be fully read (this mitigates most of the security concerns of customers).
-- disadvantage: it cannot be used for troubleshooting of issues where it is required to see the whole traffic (e.g. content of messages).
More information about Dumpcap and the usage on Wireshark's Dumpcap Manual Page
Other ways for monitoring network traffic
If you are not allowed to run Wireshark on the production server, there are several alternative ways as follows.
- WinPcap enables you to capture packets on the server by using WireShark on your workstation. See video: Wireshark Remote WinPcap Capture (Youtube)
- Netsh command which is native part of MS Windows server, description at KB: Capturing of network traffic without capture software installation.