An easy way how to collect the performance of Windows 2012 server (similar steps may be used on other version of Microsoft operating system).
Applies to YSoft SafeQ 5 and YSoft SafeQ 6.
Sample situation:
Imagine that there are authentication timeouts at random times of a day and you are not sure whether the situation may be caused by insufficient performance of the server (e.g. at problematic time there is a time gap visible in YSoft SafeQ log files). As you cannot know when the issue is going to happen again, you must be capturing performance data from the server until the issue occurs. However it is necessary to set size/duration capture (to avoid disk depletion; you do not need data one month backwards when the issue occurred just day ago). It will be also nice to have data rolling in specific intervals (it is more difficult to work with large capture files containing last week of capture than operating a small capture file containing the hour of capture where issue has happened).
Goals for the Configuration:
- capturing data in production hours from 8AM till 8PM
- rolling performance data captures in hourly intervals
- generating a basic graphical report per captured period
- keeping maximally 10GB of data
- archiving old report data after three days (to minimize the size) and deleting them after 7 days
Resolution:
Setting up the Performance Capture
- Creating a collector set
- Run perfmon.msc
- Expand "Data Collector Sets" > right-click "User Defined" > New > Data collector set
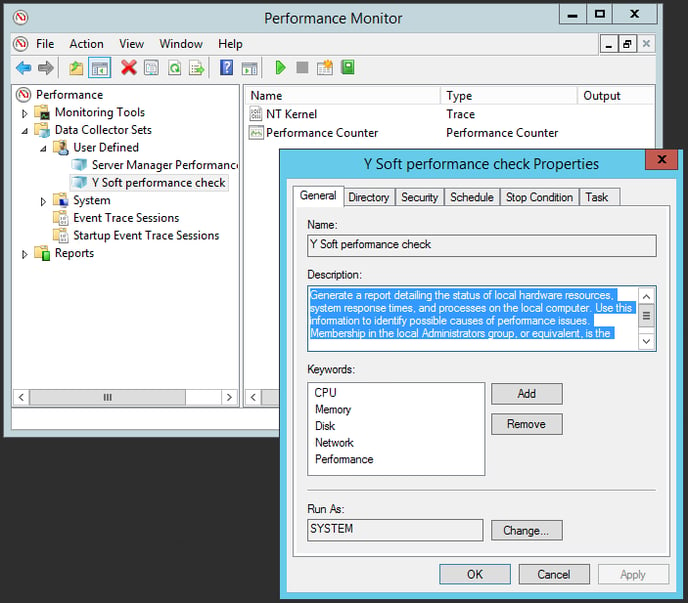
- Set the name (e.g. "Y Soft performance check") > select "Create from a template" > Next
- Select "System Performance" > Next
- Specify the path where the outputs shall be stored > Finish
- Setting up a collector set
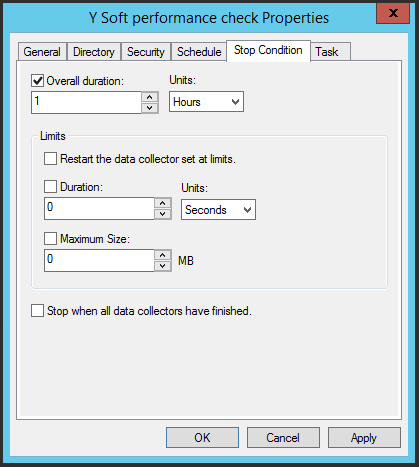
- Right-click your collector set > Properties > Stop condition
- Set Overall duration to 60 minutes and confirm it by pressing "OK"
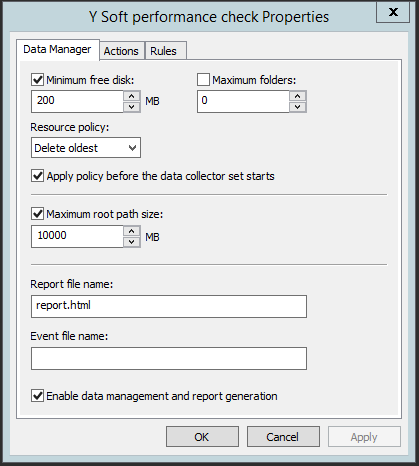
- Right-click your collector set > "Data Manager"
- un-tick checkbox "Maximum folders"
- set "Resource policy" to "Delete oldest"
- set "Maximum root path size" to 10000MB and confirm it by pressing "OK"
- Setting up a scheduled task
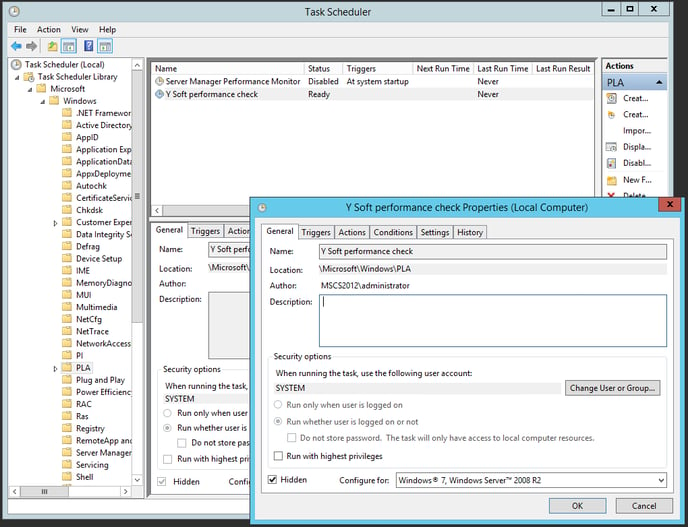
- Run taskschd.msc
- Browse to structure "Task Scheduler Library" > Microsoft > Windows > PLA
- Double-click the scheduled task that has the same name as your collector set
- Edit the schedule in a following way:
- Triggers > New > Edit following settings and confirm by OK:
- Daily, Start at current date from 8AM, reoccur every 1 days
- Repeat task every 1 hour for a duration of 12 hours
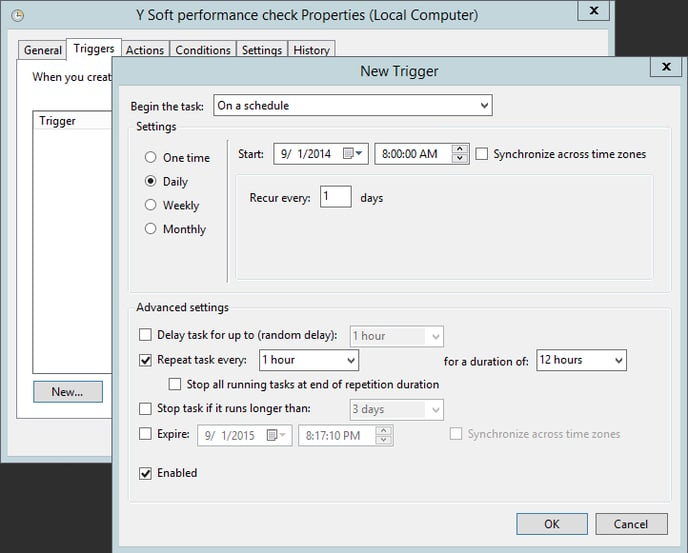
- Settings
- Queue the new instance
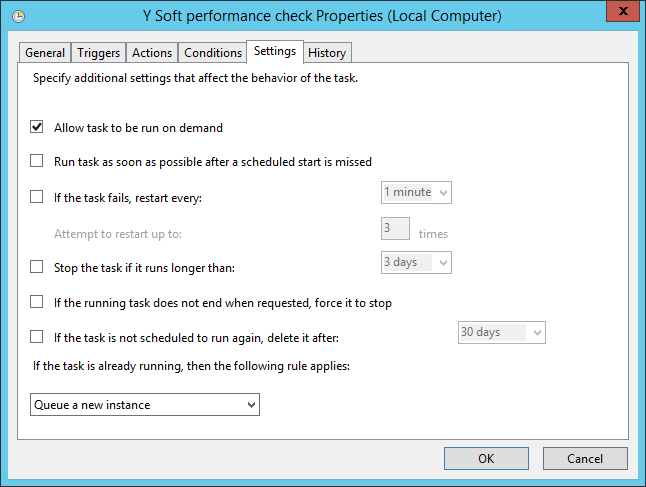
- Queue the new instance
- Confirm schedule by "OK"
- Triggers > New > Edit following settings and confirm by OK:
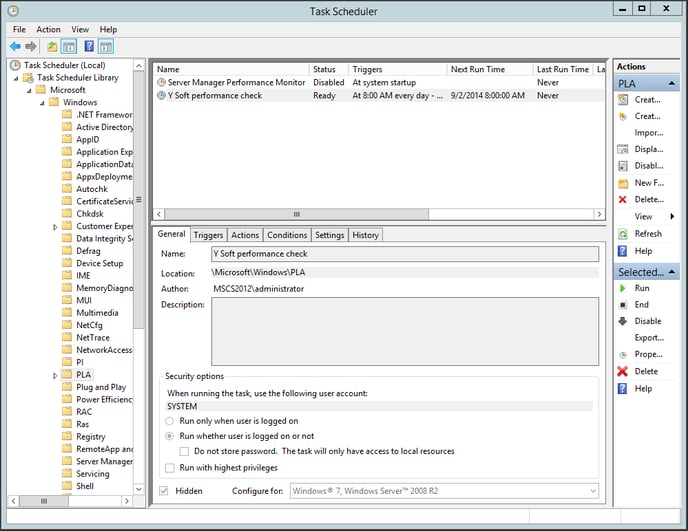
- Verify the "Next Run Time" is scheduled for the closest possible time that fits to your configuration and that Status is "Ready".
- Test that scheduled task works
- Right-click your scheduled task > Run
- Task "Status" must switch to "Running"
- Wait two minutes > Status must be still "Running"
- Right-click your scheduled task > End > Yes
-
Task "Status" must switch to "Ready"
On Windows 10 and Windows 2019 the Scheduled task may stop by itself in a few seconds without generating any diagnostic data. In such a case follow:
Microsoft Documentation - User defined DCS doesn't run as scheduled
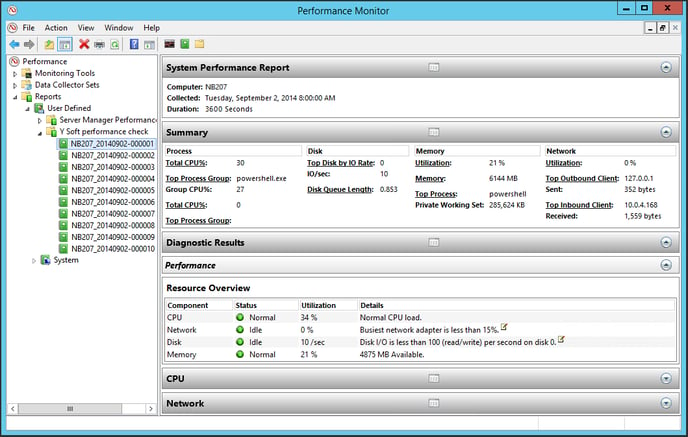
Viewing the Collected Data
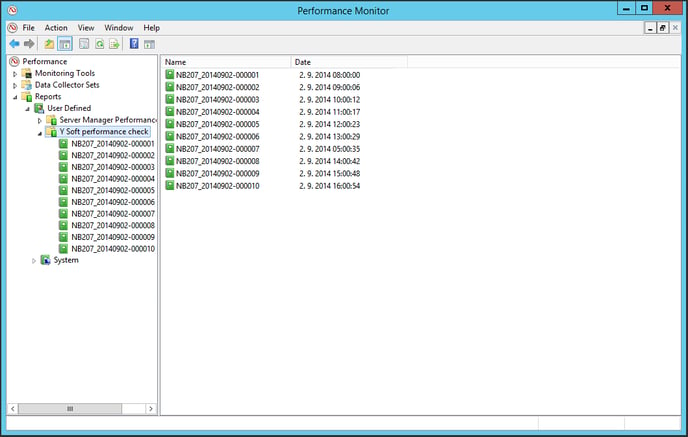
To see the collected data run perfmon.msc > Reports > User Defined > Expand the name of collector set you have defined.
Note: To understand in details to the outputs of perfmon, kindly see the documentation of your operating system or contact Microsoft technical support.
- You can see captures from various collectors showing the exact time the collection has started.
- You can right-click any output on the left side > select "View" > "Report" and see the report the pefmon has already generated for you. The "Summary" and "Diagnostic Result" may show you general performance over the evaluated period. To display detailed data simply open a relevant category (e.g. Disk > Physical disk > see "Avg. Disk sec/Transfer").
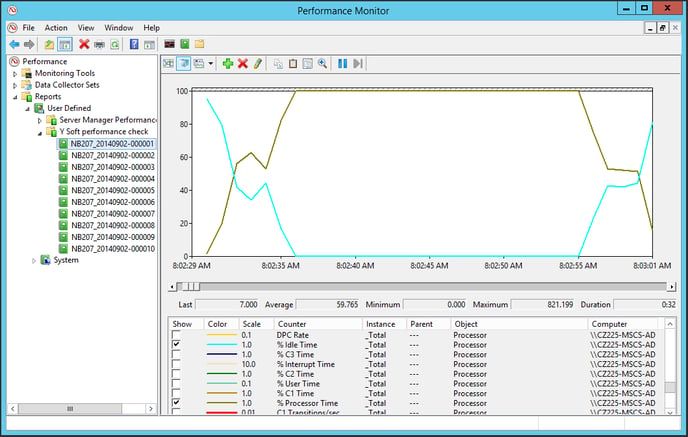
- You can right-click any output on the left side > select "View" > "Performance Monitor" to see the detailed performance data. Zooming in and selecting appropriate time frame may around the time of occurrence may reveal important information (such as high CPU usage).
- You can right-click any output on the left side > select "View" > "Folder" to view the capture data. These data can be collected and shared with your colleagues or Y Soft customer support services when requested.